
Current and ongoing reaction on distributed tracing has been varied and divergent. There’s still that strong sense that distributed tracing is a massive investment with potentially limited returns for large organizations. This notion will fade out as we’re progressing forward. For engineers debugging an issue where more than a few services are involved, distributed tracing becomes an inevitably invaluable tool.
So why do we care about distributed tracing? Companies have evolved their software architecture from monoliths to microservices. This evolution has resulted in the birth of large scale distributed systems.
We generally tend to face two operational challenges while dealing with distributed systems:
Managing networks in a monolithic application is a fairly simple task. The path between the client and the server is finite. This allows connectivity, performance, and security to be managed across a single or a limited set of flows. When dealing with distributed systems, the complexity of the network increases many-fold. It allows us to route transactions to the right place, scale up and down dynamically, and control access and authorization to disparate services. In the world of distributed systems, the path between client and application has got a lot more tortuous and difficult to reason about. This challenge is why tools like Envoy, Istio, and Consul are gaining traction as tools to manage distributed infrastructure connectivity.
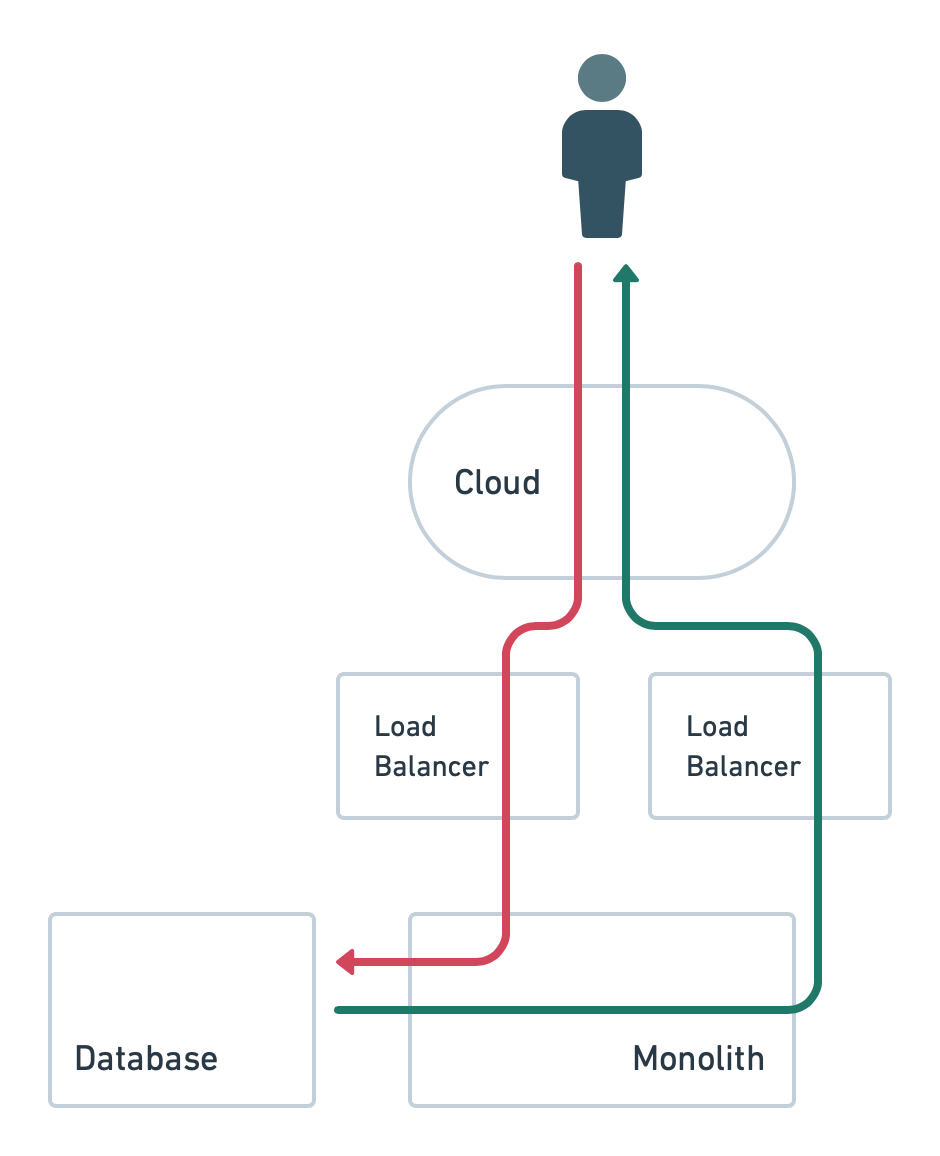
Observability is all about understanding how transactions flow through the network and infrastructure. In a monolithic app, like a Java application, for example, it’s feasible to reason about the state and performance of the transactions. A client makes a web request, perhaps through a load balancer, to a web or application server, some DB transaction is usually created and a record queried or updated, and a response is generated back to the client.
 Monolith
Although there are hops in the entire process, transactions generally take a linear path from the client to the server.
 Monolith trace
a1 request.a1 request hits network.a1 request terminates at load balancer.a2 request originates from load balancer.a2 request terminates at application server.a3 request originates from application server.a3 response terminates at client.It’s quite possible to instrument each of the hops and visualize the state of the transaction and its performance through the monolith.
More importantly, even through those hops, we can generally map a request and response transaction to an identifier through its life cycle in the application. We can see from the life of that transaction what happened to it, how it performed, identifying bottlenecks, etc.
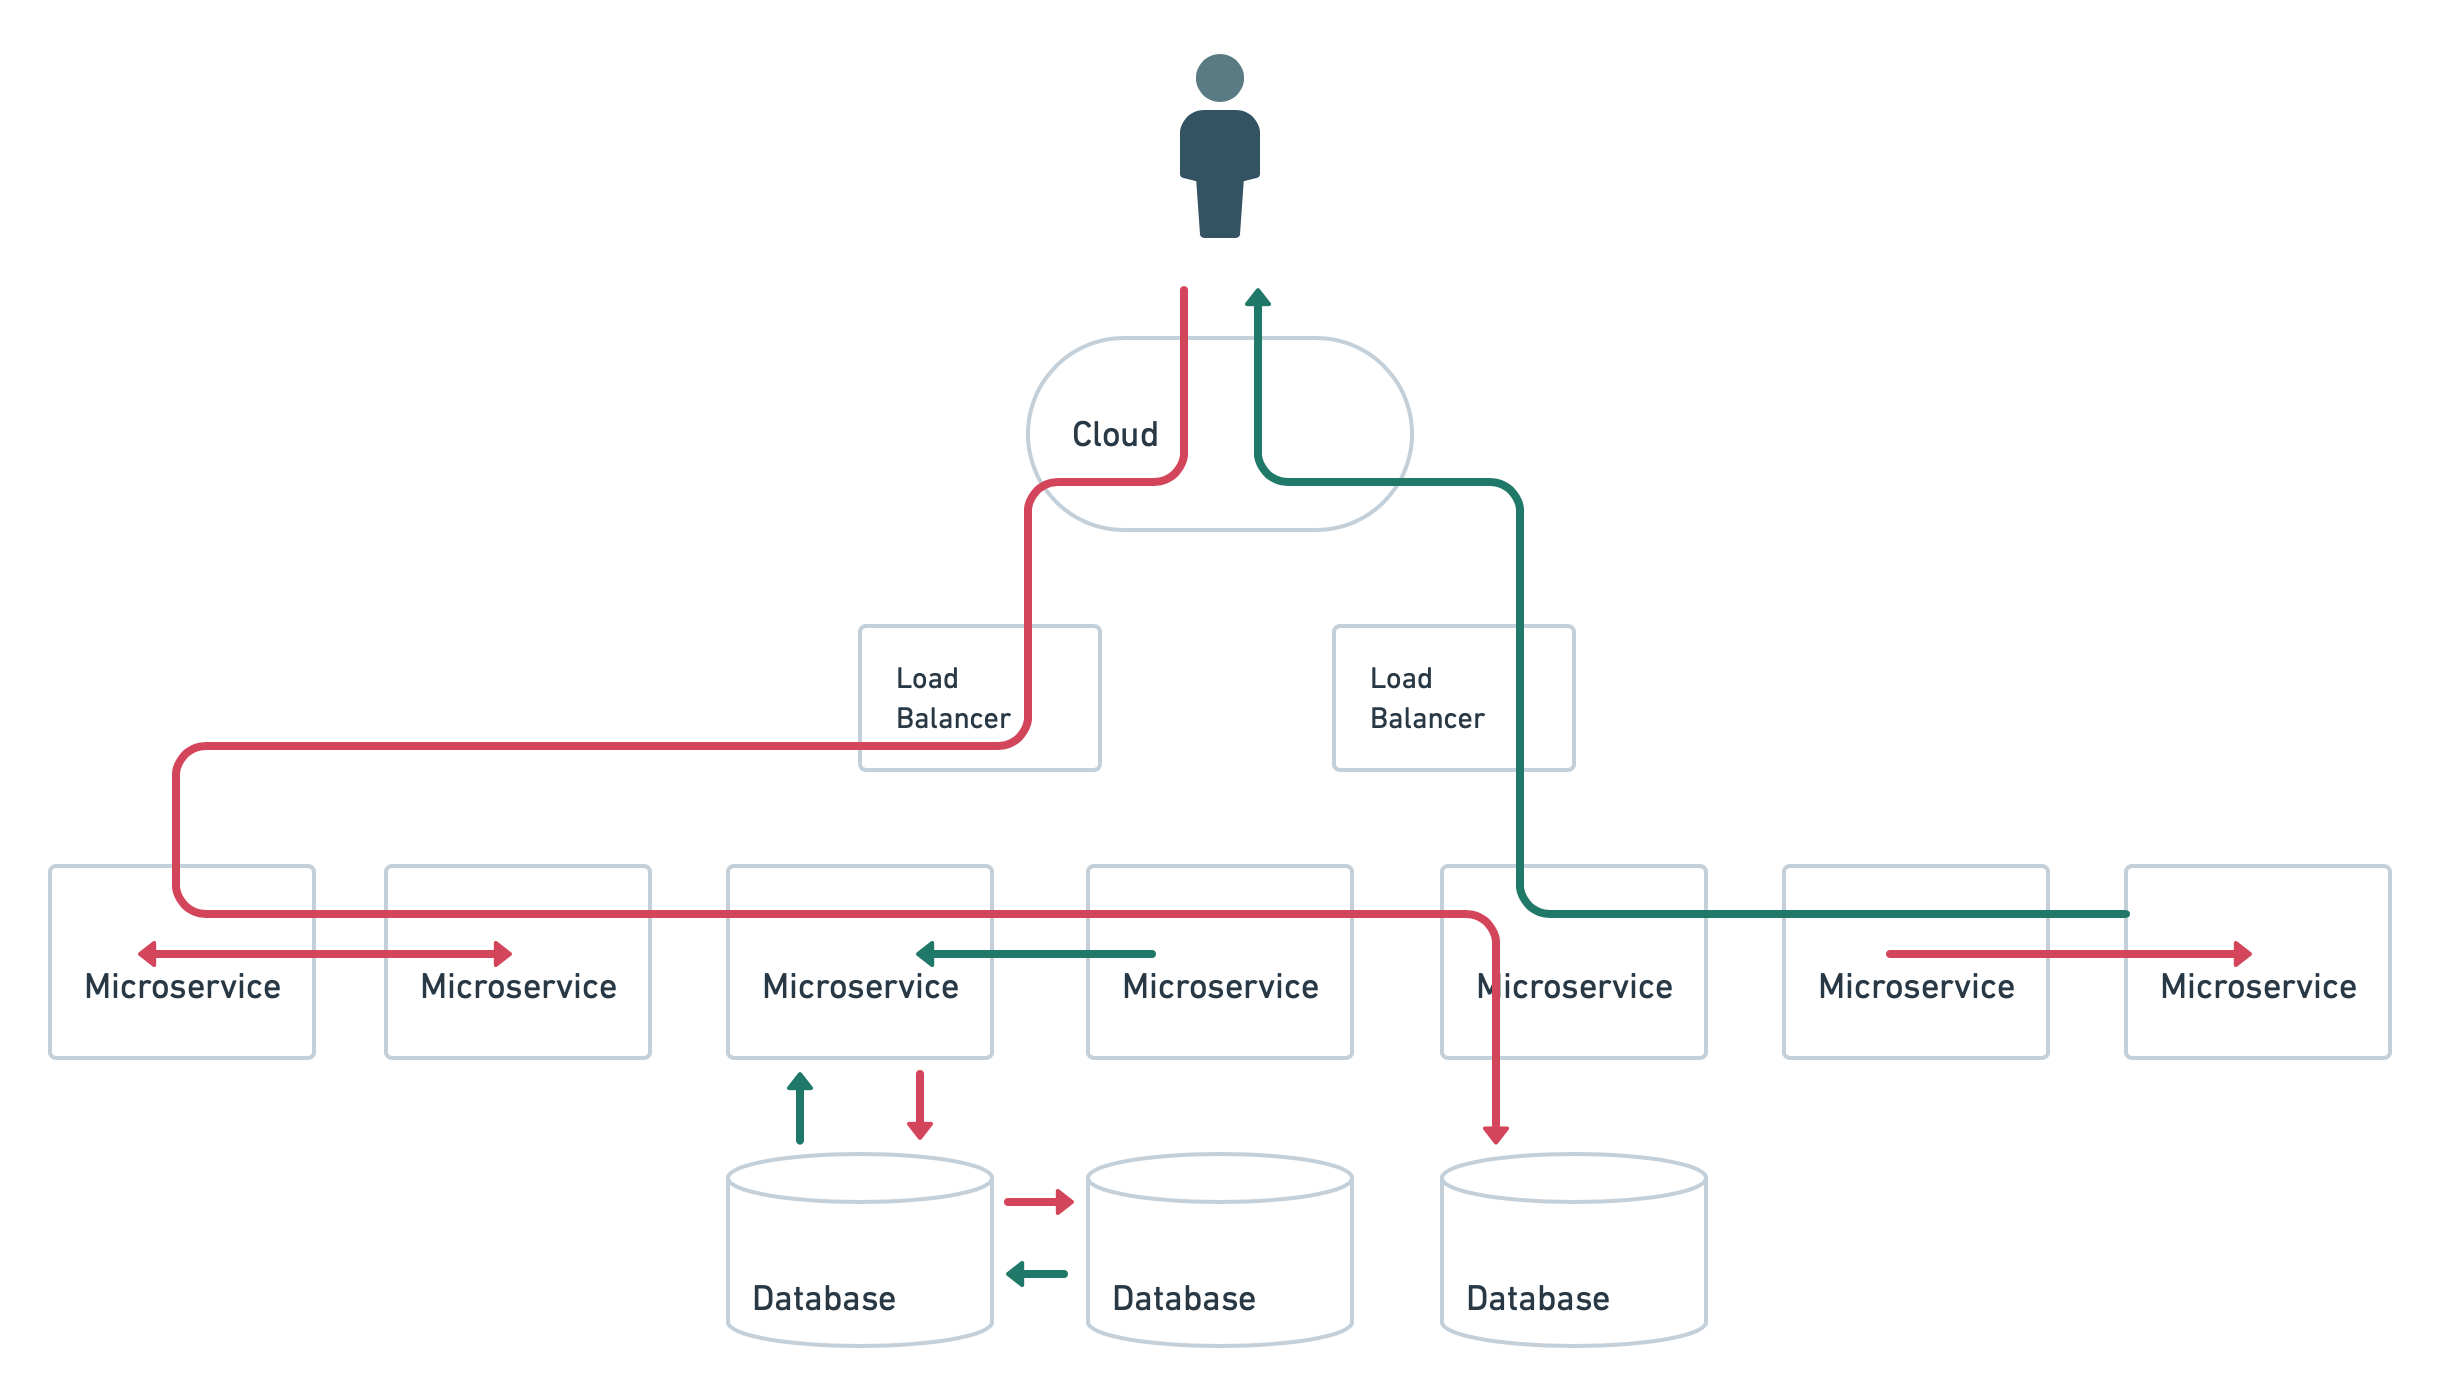
Distributed systems comprise of several microservices representing a complex entity. A transaction passes through multiple services and can trigger multiple DB transactions, other transactions or move back and forth among services.
 Distributed system
Here the path of the transaction is quite different. We’ve had assumed that our system is located in a single virtual entity. On the contrary, a distributed system mostly exists in multiple virtual locations, consist of services in the edge and services distributed across regions.
 Distributed trace
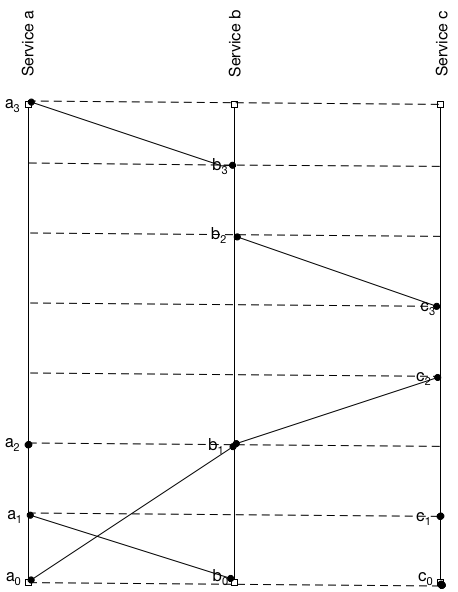
a0 request.a0 sends a message to Service b.c0 executes a local event.a1 receives a message from Service b.c1 executes a local event.a2 executes a local event.b1 sends a message to Service c.c3 sends a message to Service b.b3 sends a message to Service a.This lack of a clear linear path makes it challenging and tedious to track transactions. It’s often hard to map a client’s request to a transaction since there is no single service. Relying on traditional and conventional tools for performance monitoring and bottlenecks might not provide clear insights on what exactly is going on where.
Tracing tracks actions or events inside our applications, recording their timing and collecting other information about the nature of the action or event. To effectively use distributed tracing, we need to instrument our code to generate traces for actions we want to monitor, for instance, a HTTP request. The trace wraps the request and records the start and end time of the request and response cycle.
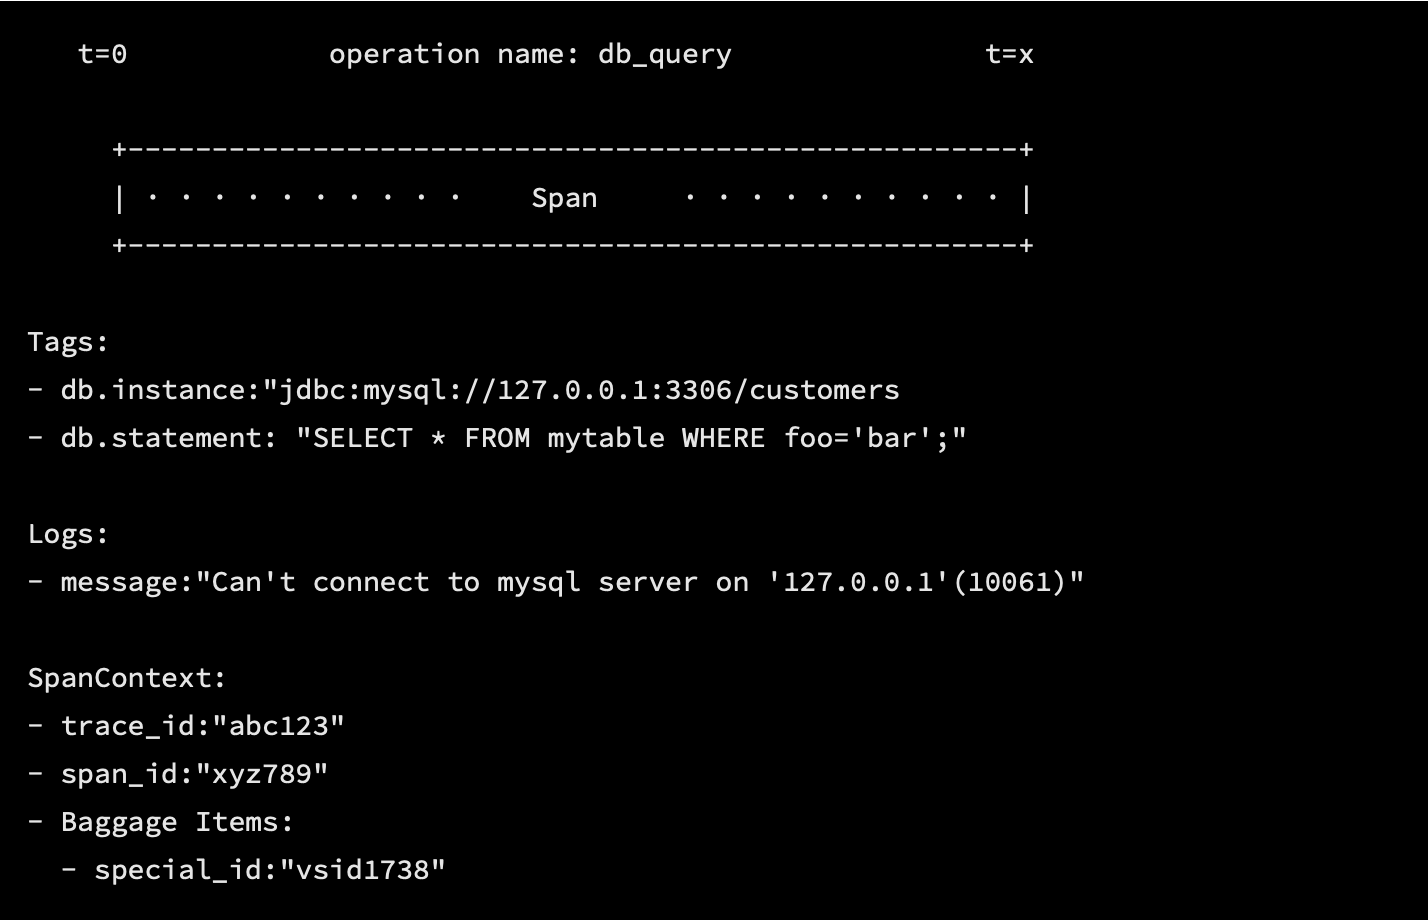
A span is the primary component of a trace. A span represents an individual unit of work done in a distributed system. Spans usually have a start and end time.
A trace constitutes more than one span. In our example above, our a2, b3, etc requests are spans in a trace. The spans are linked together via a trace ID. This makes it possible to build a view of the complete life cycle of a request as it propagates through the system.
Spans can also have user-defined annotations in the form of tags, to allow us to add metadata to the span to provide assistance in understanding where the trace is from and the context in which it was generated.
Finally, spans can also carry logs in the form of key:value pairs, useful for informational output from the application that sets some context or documents some specific event.
The OpenTracing documentation depicts an example of a typical span that illustrates the concept.
 open tracing
This trace data, with its spans and span context, is then supplied to a back end, where it is indexed and stored. It is then available for querying or to be displayed in a visualization tool such as Grafana.
Distributed tracers are monitoring tools and frameworks that instrument distributed systems. The landscape is relatively convoluted. Several companies have developed and released tools to address the issues, although they remain largely nascent at this stage. Let’s look at the first two principal tracing frameworks.
OpenCensus and OpenTracing are both tools and frameworks. They both attempt to produce a “standard”, although not a formal one, for distributed tracing.
OpenCensus is a set of APIs, language support, and a spec, based on a Google tool called Census, for collecting metrics and traces from applications and exporting them to various back ends. OpenCensus provides a common context propagation format and a consistent way to instrument applications across multiple languages.
An alternative to OpenCensus is OpenTracing. OpenTracing provides a similar framework, API, and libraries for tracing. It emerged out of Zipkin to provide a vendor-agnostic, cross-platform solution for tracing. Unlike OpenCensus it doesn’t have any support for metrics. A lot of the tools mentioned here, like Zipkin, Jaeger, and Appdash, have adopted OpenTracing’s specification. It’s also supported by commercial organizations like Datadog and is embraced by the Cloud Native Computing Foundation.
Let’s look into a few tools which are more inclined towards monitoring:
Zipkin was developed by Twitter and is written in Java and is open source. It supports Cassandra and Elasticsearch as back ends to store trace data. It implements HTTP or Kafka as the communication protocol, although other protocol options exist, such as Apache ActiveMQ, gRPC and RabbitMQ.
Zipkin has a client-server architecture. It calls clients “*reporters*”, these are the components that instrument our applications. Reporters send data to collectors that index and store the trace and pass them into storage.
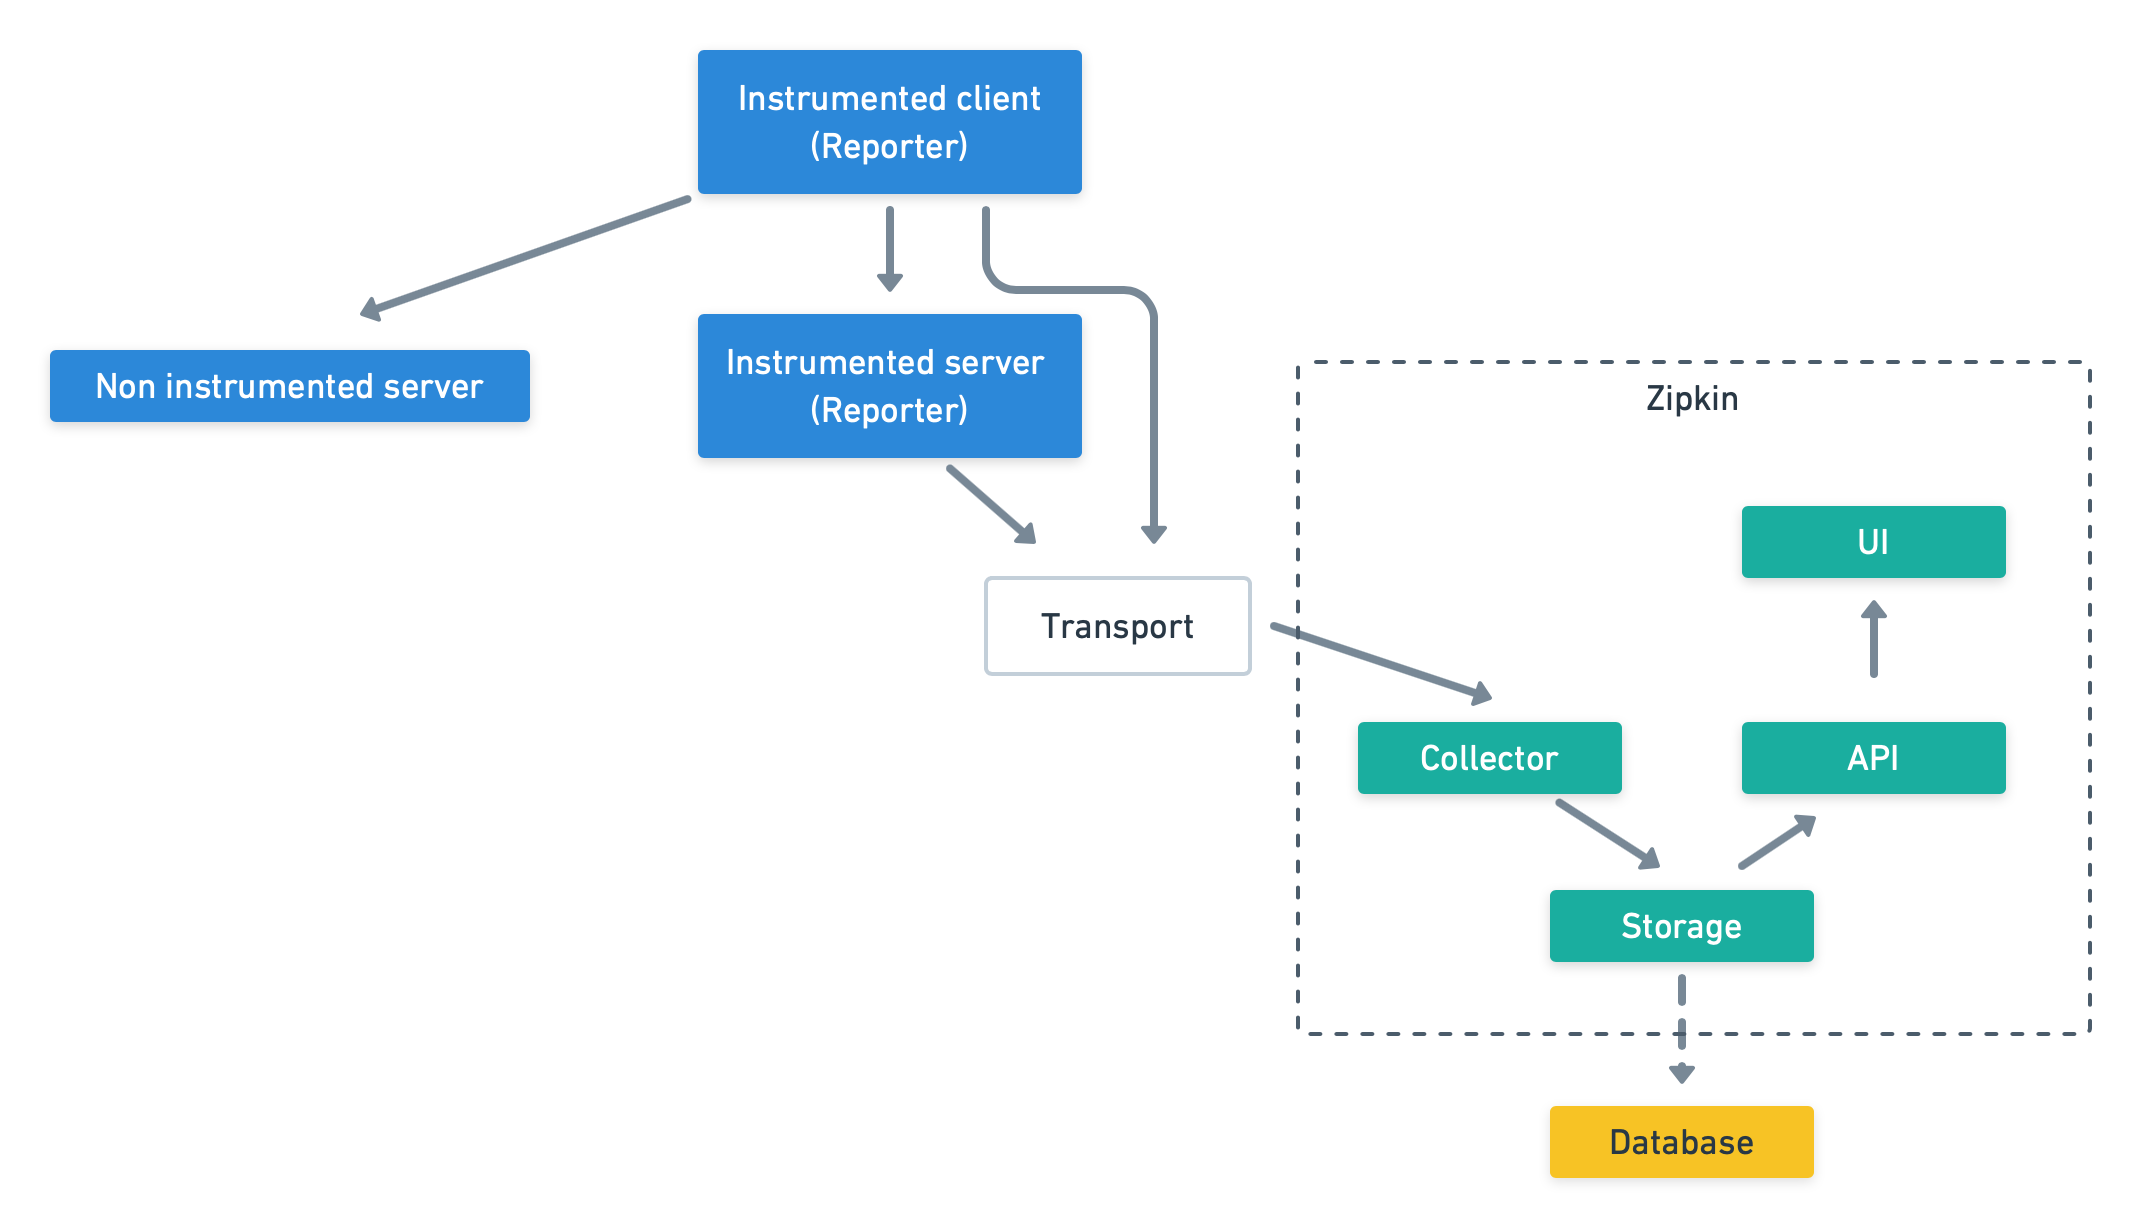 zipkin
Zipkin’s slightly different from a classic client-server app though. To prevent a trace blocking, Zipkin only transmits a trace ID around to indicate a trace is happening. The actual data collected by the reporter gets sent to the collector asynchronously, much like many monitoring systems send metrics out-of-band. Zipkin is also equipped with a query interface/API and a web UI that we can use to query and explore traces.
Jaeger is the product of work at Uber. It’s also incubated by CNCF. It’s written in Go and like Zipkin uses Thrift to communicate, supports Cassandra and ElasticSearch as back ends, and is fully compatible with the OpenTracing project.
Jaeger works similarly to Zipkin but relies on sampling trace data to avoid being buried in information. It samples about 0.1% of instrumented requests, or 1 in 1000, using a probabilistic sampling algorithm. You can tweak this collection to get more or fewer data if required.
Like Zipkin, Jaeger has clients that instrument our code. Jaeger though has a local agent running on each host that receives the data from the clients and forwards it in batches to the collectors. A query API and Web UI provides an interface to the trace data.
Like Jaeger, Appdash is open source and Go-based but created by the team at Sourcegraph. It also supports OpenTracing as a format. It hasn’t been as mature as the other players and requires a bit more fiddling to get started with and lacks some of the documentation.
Appdash’s architecture is reminiscent of Jaeger, with clients instrumenting your code, a local agent collecting the traces, and a central server indexing and storing the trace data.
The idea behind this post is to give you a basic understanding of distributed tracing and why is it a necessity when dealing with multiple microservices. I encourage you to explore the above mentioned tools, list the major workflows in your applications and instrument them. This will soon serve as an immensely powerful window in understanding the end to end workflow of how your application behaves and performs.