
False positives are the bane for any sort of a correctness verification engine. For the uninitiated, a false positive is a result that incorrectly indicates that a particular condition is true or positive. In the context of static analysis for defect detection, it refers to a defect (or issue) pointed out by the tool that is simply invalid or incorrect. In some cases, the detection logic could be flawed or does not handle some specific cases. In most cases, though, the incorrect results come from the context of the analyzed code being different than what was assumed for the tool’s logic. This post explains how DeepSource’s static analysis engine that detects issues in the code handles both these cases to keep the rate of false positives to a minimum — less than 5%, to be precise.
Let’s look at a security issue that DeepSource detects in a Python codebase that comes from the popular security analysis tool Bandit which we use behind the scenes. It is not recommended to use the assert keyword anywhere except the tests because if the Python byte code is optimized, the Python interpreter removes all lines that contain this keyword. So, if you’re validating a critical condition using the assert keyword — which a lot of developers do, unfortunately — it can leave the application vulnerable to security issues since the condition won’t be validated at all. Now, if a tool doesn’t understand which files are test files and which ones are not, it will raise this issue in all the files. All these issues raised in all the test files would, therefore, be false positives because, well, they are test files.
While this is a simple example, it turns out that understanding the context in a scenario such as the one mentioned above is generally out of scope for static analysis based defect detection systems present today. Therefore the results from most of these tools are littered with a very high number of false positive issues. This renders the results invariably useless and reduces the developer’s trust in the tool.
Why have developers not embraced static analysis tools for code review automation — which is obviously a great idea — you ask? This right here is the primary reason.
DeepSource helps developers find and fix issues in their code. We do this by detecting complex problems in the code, and enabling developers to fix most of these issues automatically in a couple of clicks with Autofix, our automated fixes generation engine. Lowering the rate of false positives reported by the tool is imperative for us because it is crucial for our users to:
When we started building DeepSource, we were very well aware that the adoption of DeepSource as the de-facto static analysis tool is going to be directly proportional to how low our false positive rates are. Our hypothesis was validated by Google when they wrote a seminal paper in 2018 about how they implemented static analysis as a process in their workflows and how critical reducing false positive rates were in that process to ensure adoption within the organization. We chose to anchor 5% as our goal for allowed false positives since it made sense in terms of the experience we wanted to target for our users.
The fact remains that code review automation tools have not been adopted widely by developers and engineering teams, and stay confined to teams that can afford time and resources to build and maintain bespoke systems in-house. DeepSource’s mission is to fix that by bringing code review automation to every developer and engineering team in the world. A low rate of false positives is a critical component for that kind of adoption to happen.
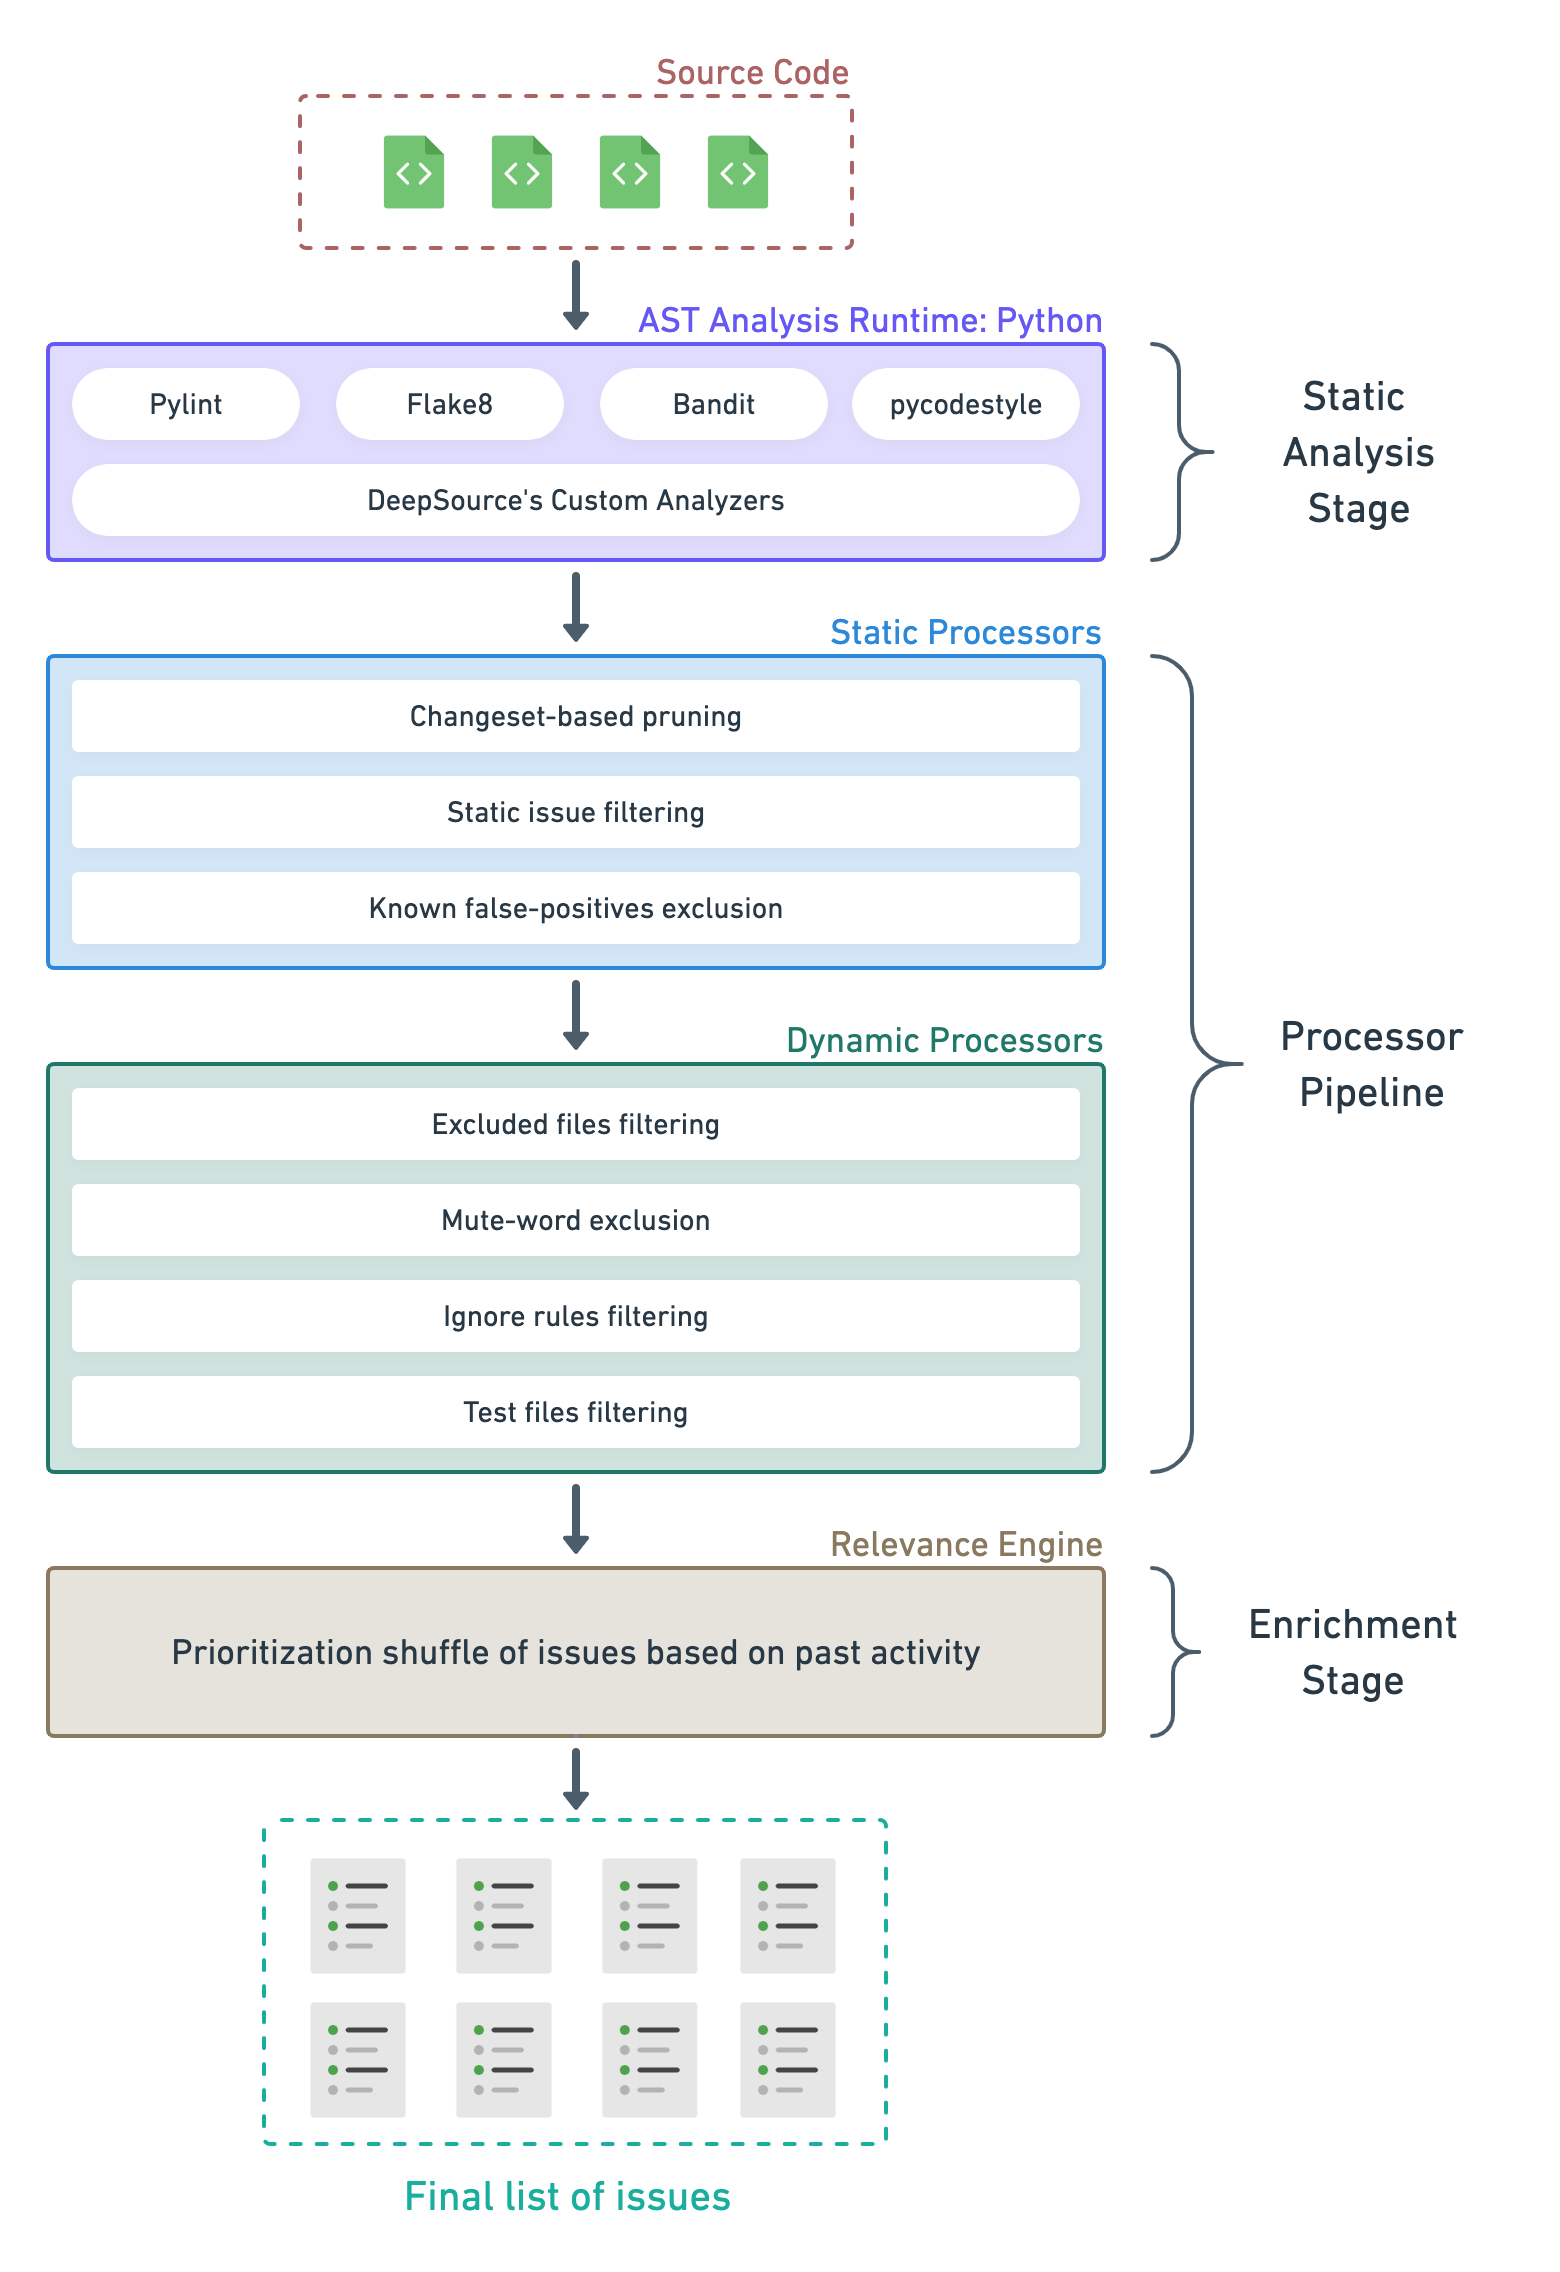
To detect issues in the code such as bug risks, anti-patterns, performance issues, and security vulnerabilities, we analyze the code’s abstract syntax tree (AST). This is similar to what other source code analysis platforms do, and also many open-source command-line based tools. But on DeepSource, this is just the very first step. The results of the AST analysis then go through a pipeline of processors that prune the results, and then through a relevance engine that makes sure the issues are shown in the most relevant order to the users. The final result is a list of issues that is free of noise and, ideally, has less than 5% of false positives.
Let’s look at each stage in detail. Later in the post, we’ll string together all these steps to see the full picture.
As the name suggests, this stage performs static analysis to detect the initial list of issues. At this point, the list contains all the issues that the analyzer can possibly detect in the code. If you were to look at the list of issues here, it can be overwhelming.
The AST Analysis Runtime takes your entire source code and runs a number of tools over it. In this example of the Python analyzer, open-source tools like Pylint, Flake8, among others are run in addition to DeepSource’s custom analyzers that we develop and maintain in-house. The open-source tools also contain multiple augmentations and patches to their code to handle known false-positives reported by DeepSource users. At this stage, the false positives caused due to flawed analysis logic are taken care of. Since we write our own analyzers and maintain our own augmentations to 3rd party tools, it is convenient for us to fix those false positive reports that need change to the AST analysis logic or additional handling of an edge case.

When users report a new false positive on an occurrence of an issue from the DeepSource dashboard, our Language team judges for the validity and makes changes to our analyzers to resolve the false positive. We aim for a turn around time of fewer than 72 hours, but most reports get a resolution within 12-18 hours. Every week, the team resolves at least 50 valid false positive reports from our users.
The analysis enters the Processor Pipeline next. In this stage, all the issues detected during the Static Analysis stage are passed through multiple processors. Each processor prunes the results based on a specific rule, removing noise and false positives based on the context, and passing on the filtered list of issues to the next one in the line.
The issues pass through two sets of processors, that perform slightly different tasks:
These processors prune the list of issues based on static rules, which do not depend on the user’s or the repository’s context. The logic of these processors are opinionated and are maintained by our Language team, but are inspired from best practices that we’ve either cherry-picked from other defect detection systems, or from user feedback to make the experience better.
Here’s the list of the static processors that DeepSource runs at the moment:
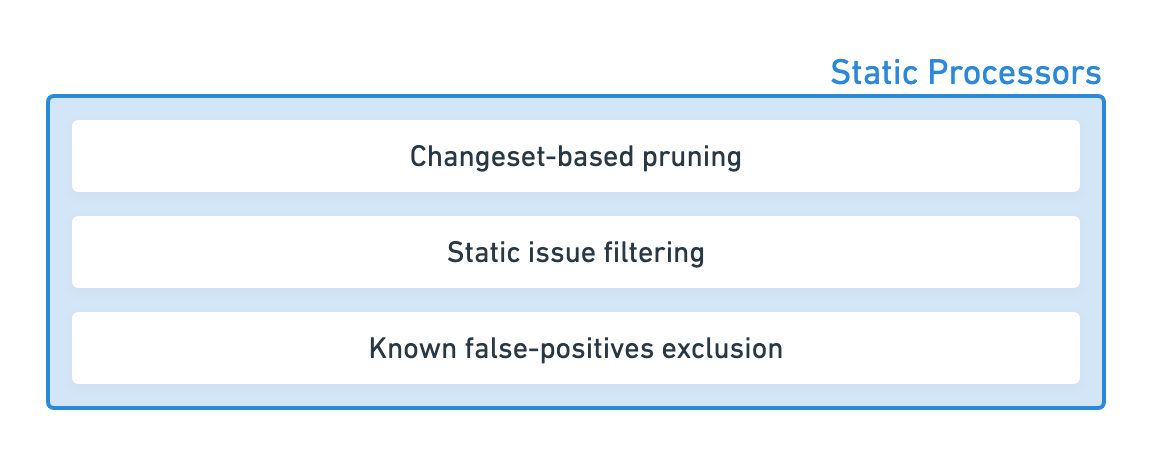
__init__.py file of a module to control what public names are directly exported with that module. Raising an unused import warning here is considered a false positive in almost all cases. This association is very common and is filtered out by the processor.The dynamic processors prune the incoming issues from the static processors based on the user’s preferences set explicitly on the repository or the organization.
Let’s look at each processor separately:
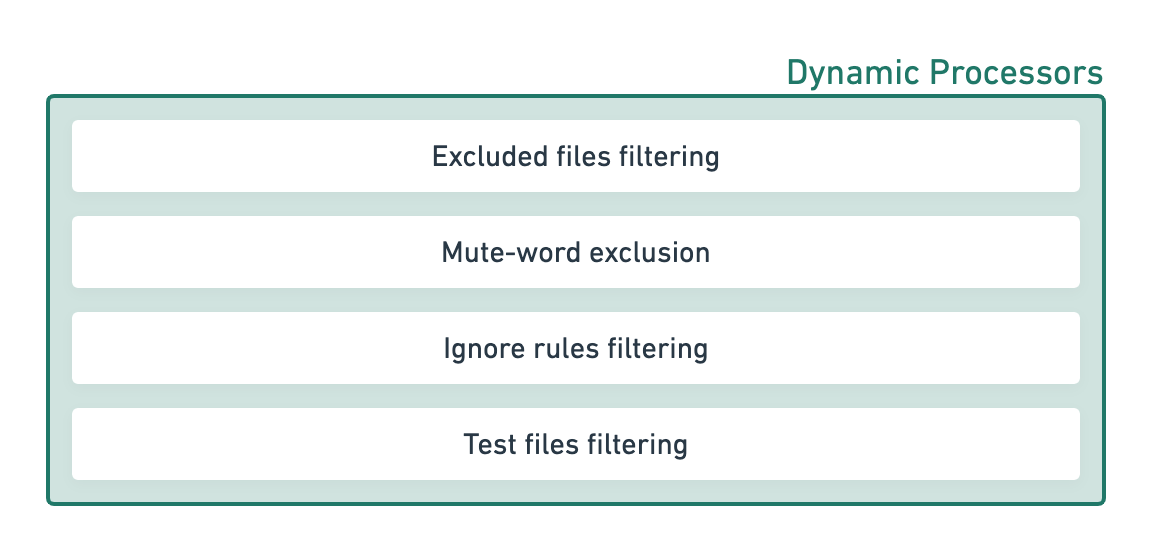
Excluded files filtering: Developers can exclude files and folders from being analyzed by adding glob patterns in the .deepsource.toml file of the repository (docs). This is a convenient way to exclude auto-generated files (like database migrations) or examples from being analyzed.
Mute-word exclusion: At times, you don’t want to fix an issue either because it’s deliberate, or it is a false positive for your unique context. Generally, open-source tools provide mute words to suppress individual occurrences of issues raised by them but each tool has its own specific mute word. We’ve created a single generic mute-word called skipcq that allows you to suppress individual occurrences of all issues across all analyzers (docs). The skipcq mute-word is also used to audit and approve security issues, where this semantically means that someone has looked at the potential security vulnerability and deemed it safe.
Ignore rules filtering: If mute-words are specific and generally scoped to individual occurrences, DeepSource allows you to create sophisticated ignore rules that work on the repository level or on multiple files easily from the UI (blog post). These rules give you a powerful way to triage issues raised in the codebase based on your team’s preferences and context.
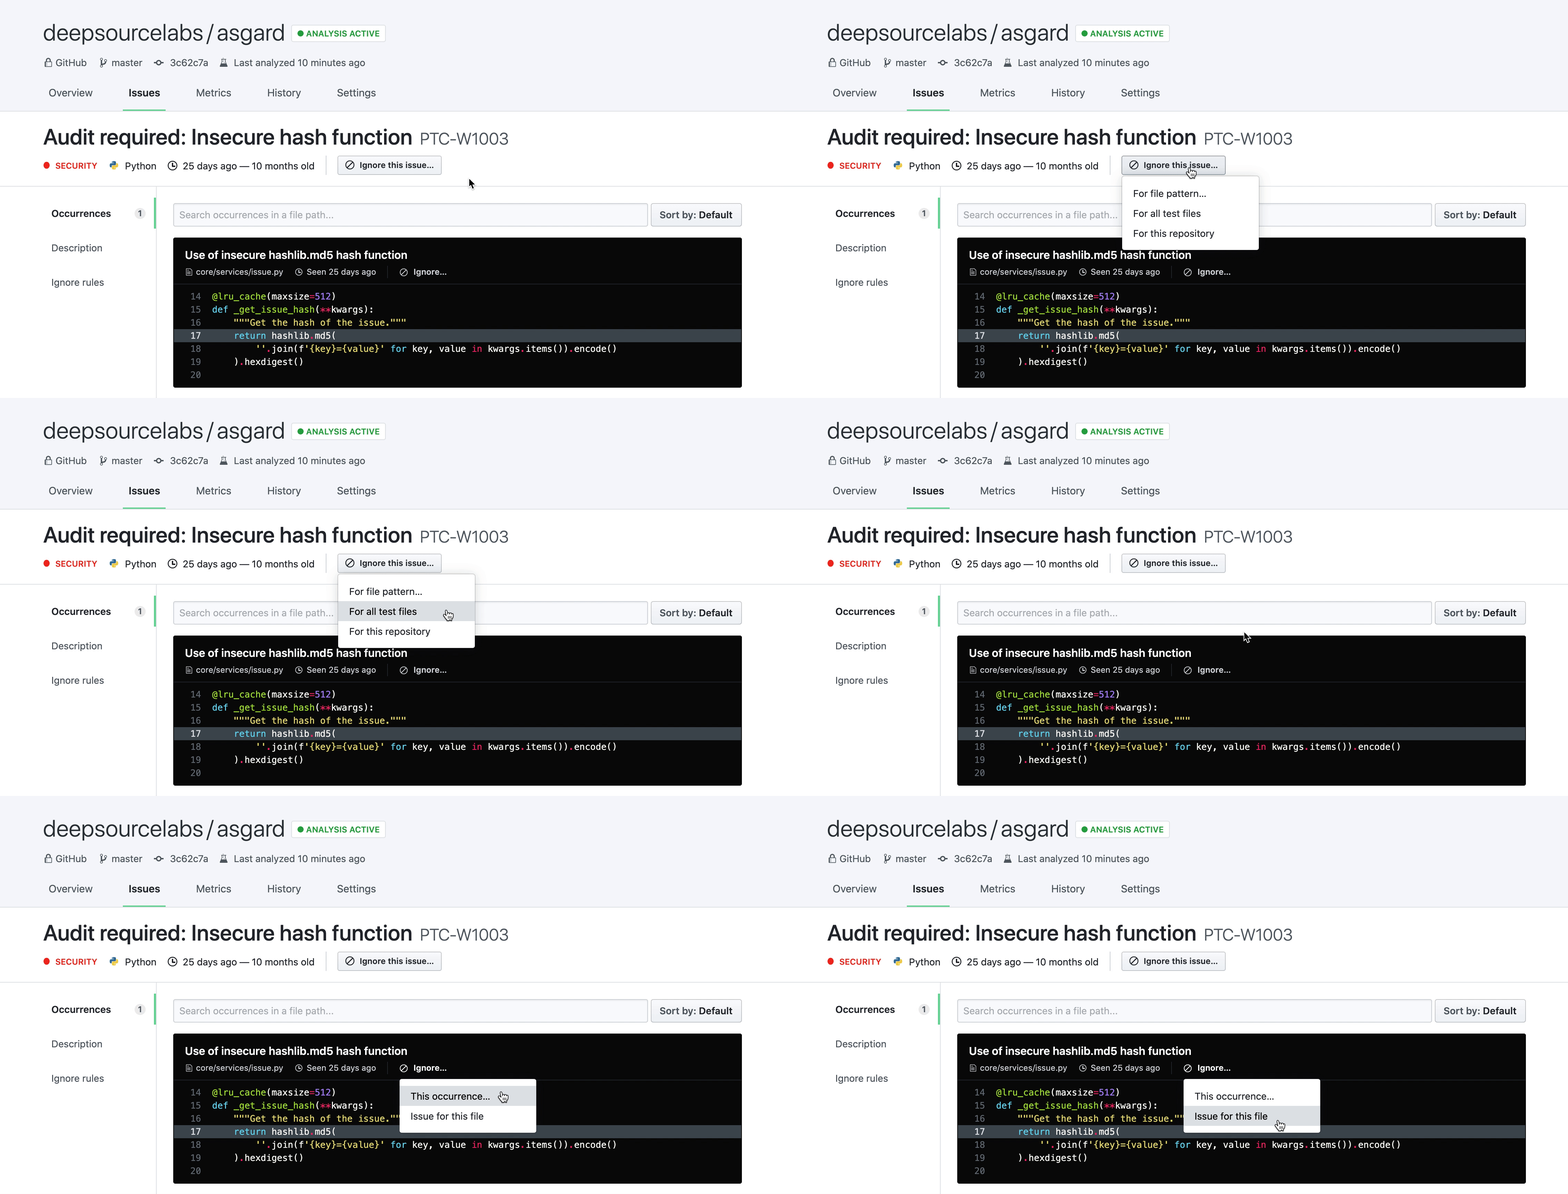
Test files filtering: We treat test files especially since most teams have different standards of code quality for their application code and their test code. On DeepSource, you can create rules to ignore specific issues only in test files, and the occurrences get filtered by this processor. Read more in this blog post.
At the end of the processor pipeline, after passing through seven processors, the false positives are reliably removed from the results. You see the most relevant issues without the noise now, but there’s still something missing — the issues that you see are in an arbitrary order. It is entirely plausible that you see a minor refactoring issue at the top and a critical performance issue at the bottom. This is not something that you’d naturally expect, of course. In real life, any defect detection system must show more important issues first. But that raises another problem for us. How do we know which issues are important for your team? Of course, some issues are obviously more important than the others, but in most cases, this decision is highly contextual.

At DeepSource, we understand that just ensuring the lowest rate of false positives possible is not enough since if a developer is still not able to discover the most important issues and act on them, the value is only half-realized. To understand what issues are important for you, we look at the historical data about developer’s behavior with the code:
Each issue then gets assigned a dynamic weight by the Relevance Engine, and the final list of issues gets sorted using this weight.
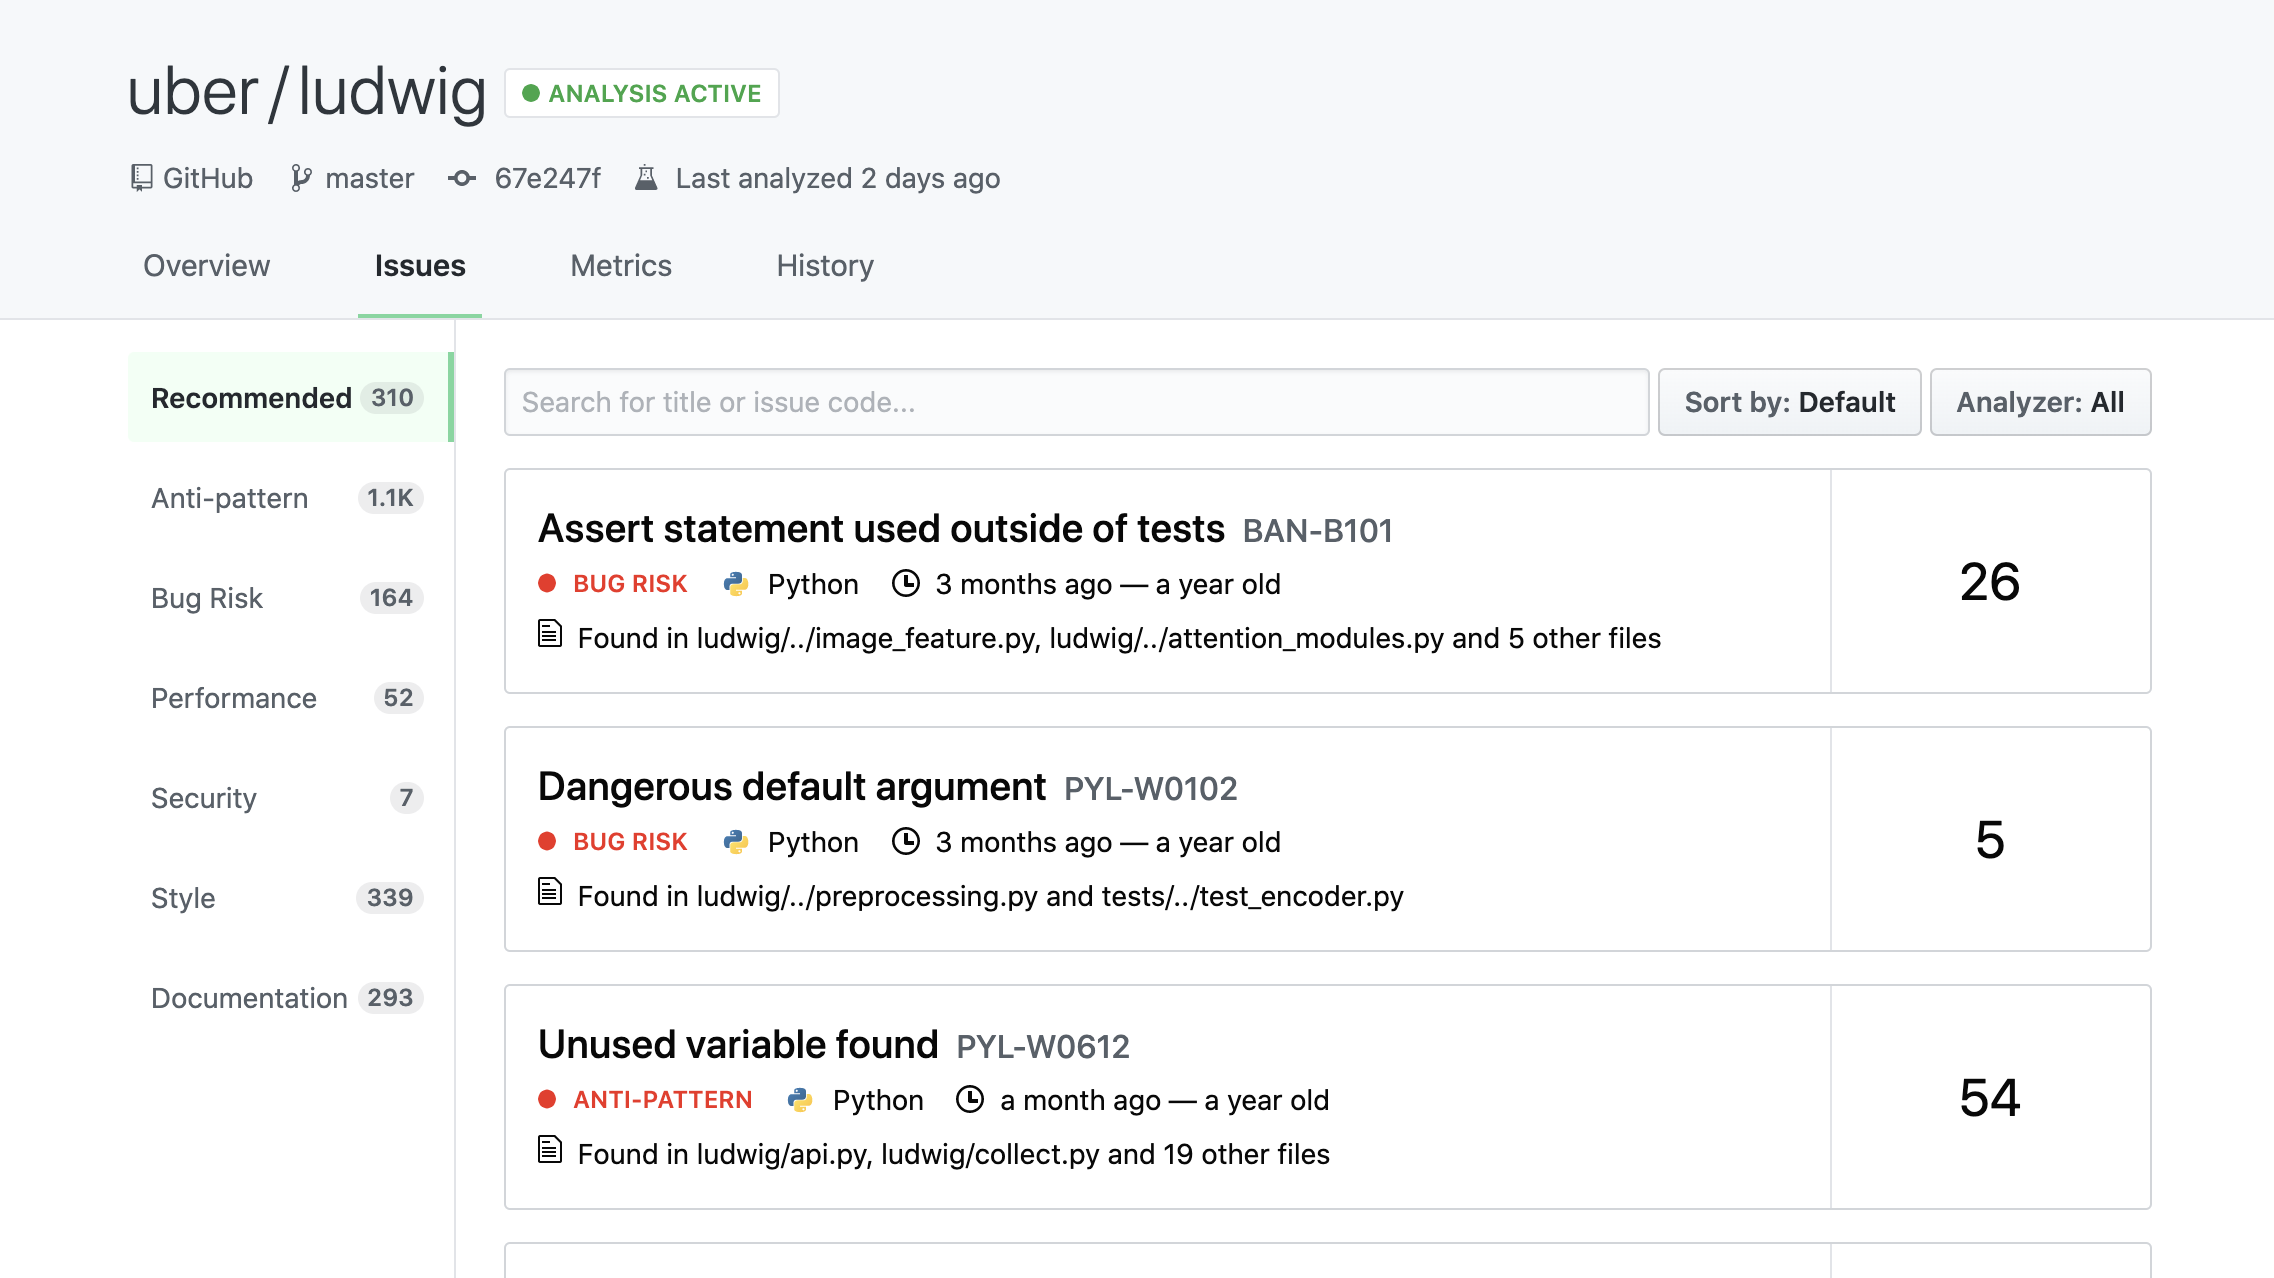
Every time that you make a pull-request on one of your repositories, DeepSource runs analysis and processes the list of issues through this pipeline. And it’s fast too! For most pull-requests, the entire analysis takes less than 10 seconds before you see the results. For larger pull-requests and full-repository analyses, the average analysis time is about 36s.
Here’s how the pipeline looks like, all put together:
We’re pushing the limits of what can be achieved using static analysis to help developers ship good code — by building better analysis tools to detect better issues, and delightful user experiences when finding and fixing these issues. If this post has piqued your interest, you should look at how we enable automated fixing of issues with Autofix.