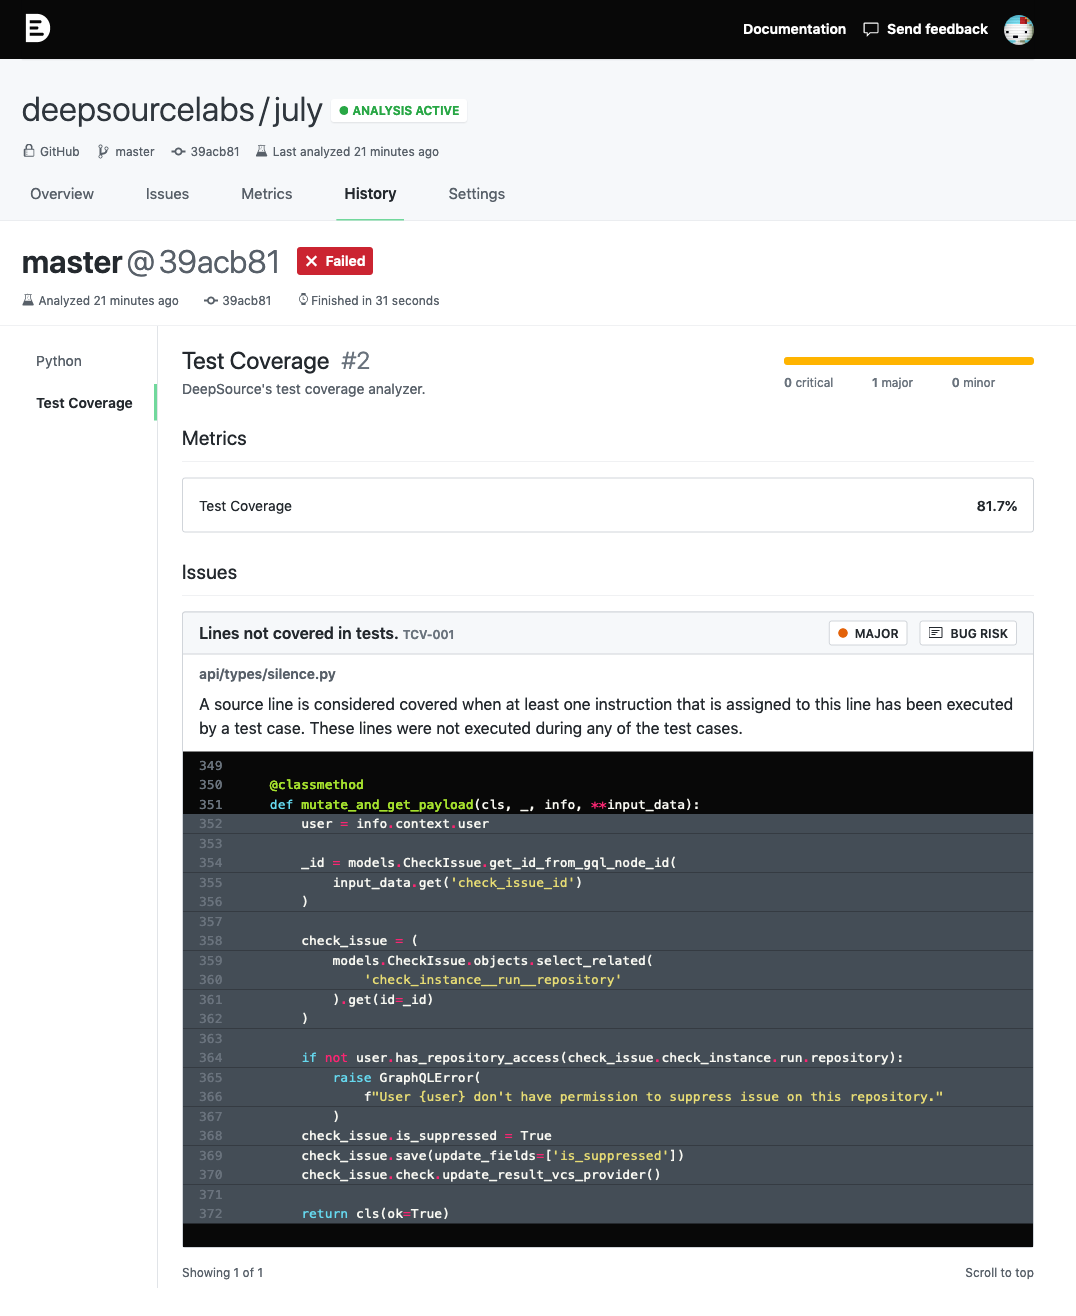
Test coverage is a great metric to track which parts of the codebase is covered by tests. Measuring test coverage helps developers get clarity on how to improve the tests to make sure all functionalities of the codebase is well-tested. If executing the test suite causes 80% of the package's source statements to be run, we say that the test coverage is 80%.
Before implementing test coverage, we were on the look out for similar products solving this. We evaluated the products and looked at them from end user’s point of view, to understand how exactly is it being used by developers. We observed very similar workflows and patterns across the tools we examined. Let’s categorize them into four parts.
On every code change, tests run as part of CI build pipelines. A coverage file is generated and reported to tools like Coveralls, Codecov, etc.
All the tools provide similar types of information. First, overall test coverage of the codebase. Second, a file browser with all the files and the coverage percentile against it.
Developers visit the project dashboard, click on a file that has coverage below threshold, browse through the file and take a look at the lines that are marked red (lines missed).
Depending on the criticality of the specific part of the codebase, the developer creates an issue in their bug tracking system to work on improving the test coverage.
At DeepSource, we strive for seamlessly integrating with native software development workflows and optimize for helping you fix issues rather than just letting you know. The all-new Test Coverage analyzer allows you to do two important things — nothing more, nothing less:
This is how it looks.

You can use our open-source CLI to report test coverage from your CI system to DeepSource — you’ll love how easy it is to set up. We’ve written guides for Travis CI and Circle CI.
Let us know what you think. Here’s what Joe, creator of Masonite framework, thinks:
“DeepSource is great! Saves a whole lot of time when it comes to code issues. It pops up alongside Masonite’s GitHub status checks so I know exactly what the issues are. I really love DeepSource!”