We truly care about root cause analysis of all our production issues at DeepSource. From debugging a PV misconfiguration and decoding cryptic tracebacks to measuring query latency and low disk throughput, we take pride in carrying our detective lenses and use it to troubleshoot problems right down to its root cause. Of course, to perform such levels of root cause analysis, one is required to establish in depth monitoring levels at every corner of the infrastructure, making everything an open book case while troubleshooting systems. Observability is of the important essence for a reliable system, without which you’re simply flying blind.
Recently, we had been bogged down with a pestering production issue which had a nasty impact on the user. Simply put, any client request would be met with a 502 NGINX error anytime a Kubernetes deployment was in progress.
Kubernetes deployments are essentially rolling in nature by default and guarantee zero downtime, but there’s a twist. It was this twist that manifested itself as an annoying issue. In order to achieve real zero-downtime deployment with Kubernetes, without breaking or losing a single in-flight request, we needed to scale our game up and bring out detective lenses for an in depth root cause analysis.
Let’s talk about rolling updates. Per default, Kubernetes deployments roll-out pod version updates with a rolling update strategy. This strategy aims to prevent application downtime by keeping at least some instances up-and-running at any point in time while performing the updates. Old pods are only shutdown after new pods of the new deployment version have started-up and became ready to handle traffic.
We specified the exact way how Kubernetes will juggles multiple replicas during the update. Depending on the workload and available compute resources we had to configure, how many instances we want to over- or under-provision at any time. For example, given three desired replicas, should we create three new pods immediately and wait for all of them to start up, should we terminate all old pods except one, or do the transition one-by-one? The following code snippets shows the Kubernetes deployment definition for an application named asgard with the default RollingUpdate upgrade strategy, and a maximum of one over-provisioned pods (maxSurge) and no unavailable pods during updates.
kind: Deployment
apiVersion: apps/v1
metadata:
  name: asgard
spec:
  replicas: 3
  template:
    # with image docker.example.com/asgard:1
    # ...
  strategy:
    type: RollingUpdate
    rollingUpdate:
      maxSurge: 1
      maxUnavailable: 0
The asgard deployment will cause the creation of three replicas of the asgard:1 image.
This deployment configuration will perform version updates in the following way: It will create one pod with the new version at a time, wait for the pod to start-up and become ready, trigger the termination of one of the old pods, and continue with the next new pod until all replicas have been transitioned. In order to tell Kubernetes when our pods are running and ready to handle traffic we needed to configure liveness and readiness probes.
The following show the output of kubectl get pods and the old and new pods over time:
$ kubectl get pods
NAME                             READY     STATUS             RESTARTS   AGE
asgard-5444dd6d45-hbvql   1/1       Running            0          3m
asgard-5444dd6d45-31f9a   1/1       Running            0          3m
asgard-5444dd6d45-fa1bc   1/1       Running            0          3m
...

asgard-5444dd6d45-hbvql   1/1       Running            0          3m
asgard-5444dd6d45-31f9a   1/1       Running            0          3m
asgard-5444dd6d45-fa1bc   1/1       Running            0          3m
asgard-8dca50f432-bd431   0/1       ContainerCreating  0          12s
...

asgard-5444dd6d45-hbvql   1/1       Running            0          4m
asgard-5444dd6d45-31f9a   1/1       Running            0          4m
asgard-5444dd6d45-fa1bc   0/1       Terminating        0          4m
asgard-8dca50f432-bd431   1/1       Running            0          1m
...

asgard-5444dd6d45-hbvql   1/1       Running            0          5m
asgard-5444dd6d45-31f9a   1/1       Running            0          5m
asgard-8dca50f432-bd431   1/1       Running            0          1m
asgard-8dca50f432-ce9f1   0/1       ContainerCreating  0          10s
...

...

asgard-8dca50f432-bd431   1/1       Running            0          2m
asgard-8dca50f432-ce9f1   1/1       Running            0          1m
asgard-8dca50f432-491fa   1/1       Running            0          30s
If we perform the rolling update from an old to a new version, and follow the output which pods are alive and ready, the behavior first of all seems valid. However, as we might see, the switch from an old to a new version is not always perfectly smooth, that is, the application might lose some of the clients’ requests.
In order to really test whether in-flight requests are being lost when an instance is being taken out of service, we had to stress test our service and gather results. The main point that we were interested in is whether our incoming HTTP requests were handled properly, including HTTP keep alive connections.
We used the simple Fortio load testing tool to siege our HTTP endpoint with a barrage of requests. This consisted of 50 concurrent connections/goroutines with a queries per second (or more appropriately, requests per second) ratio of 500 and a test timeout of 60 seconds.
fortio load -a -c 50 -qps 500 -t 60s "<http://example.com/asgard>"
The -a option causes Fortio to save the report so that we can view it using the HTML GUI. We fired up this test while a rolling update deployment was occurring, and witnessed a few requests that failed to connect:
Fortio 1.1.0 running at 500 queries per second, 4->4 procs, for 20s
Starting at 500 qps with 50 thread(s) [gomax 4] for 20s : 200 calls each (total 10000)
08:49:55 W http_client.go:673> Parsed non ok code 502 (HTTP/1.1 502)
[...]
Code 200 : 9933 (99.3 %)
Code 502 : 67 (0.7 %)
Response Header Sizes : count 10000 avg 158.469 +/- 13.03 min 0 max 160 sum 1584692
Response Body/Total Sizes : count 10000 avg 169.786 +/- 12.1 min 161 max 314 sum 1697861
[...]
The output indicated that not all of the requests were be handled successfully. We ran several test scenarios that connect to the application through different ways, e.g. via Kubernetes ingress, or via the service directly, from inside the cluster. We saw that the behavior during the rolling update varied, depending on how our test setup connected. Connecting to the service from inside the cluster did not experience as many failed connections compared to connecting through an ingress.
Now the million dollar question is, what exactly happened when Kubernetes re-routed the traffic during the rolling update, from an old to a new pod instance version. Let’s have a look how Kubernetes manages the workload connections.
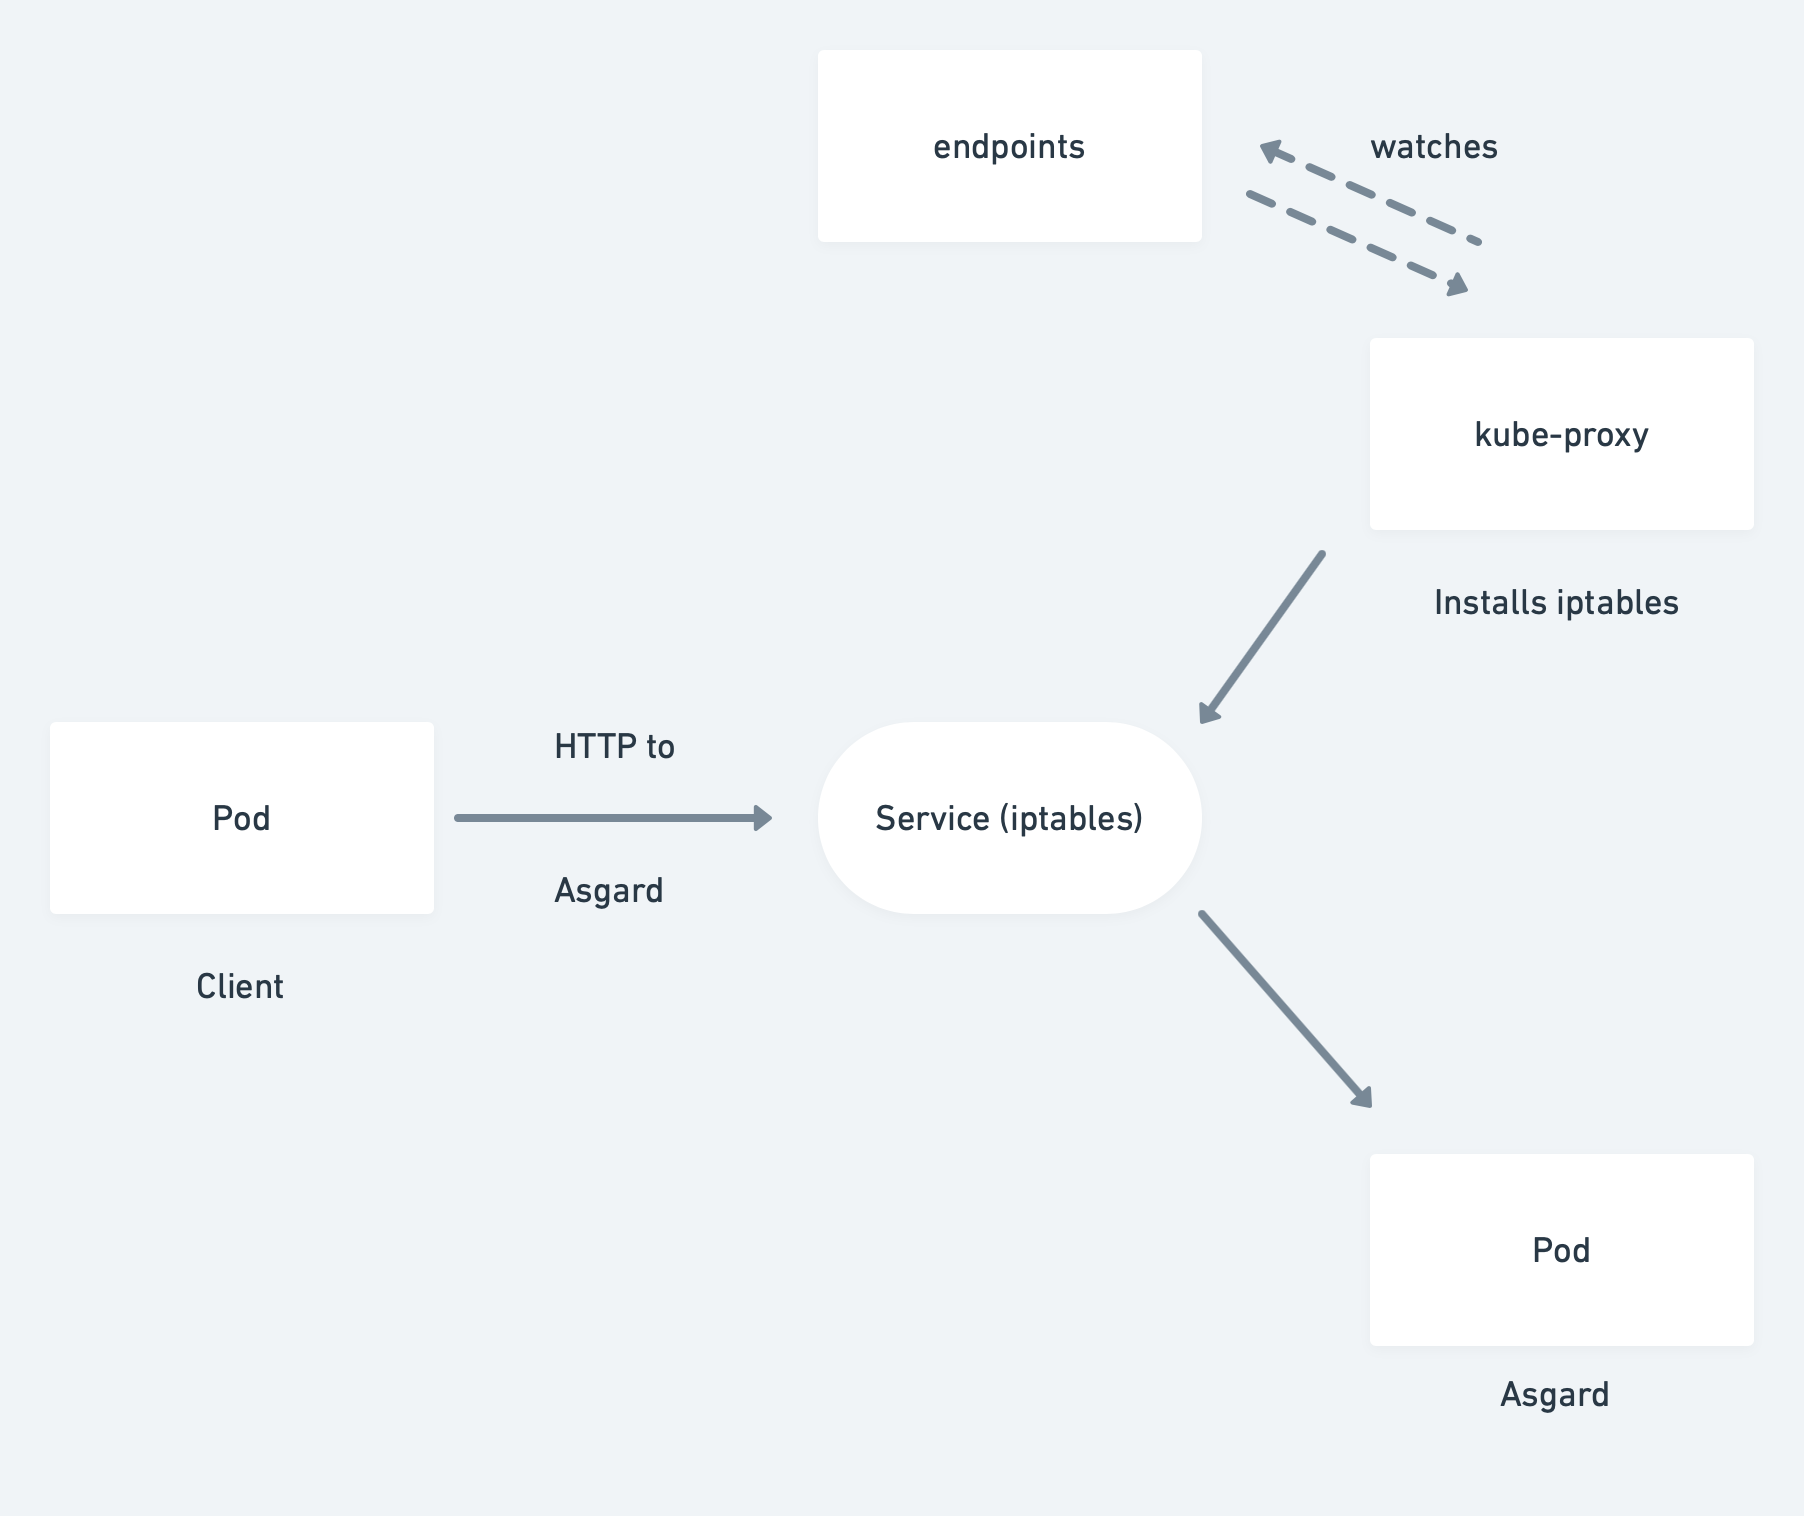
If our client, that is the zero-downtime test, connects to the asgard service directly from inside the cluster, it typically uses the service virtual IP resolved via Cluster DNS and ends up at a Pod instance. This is realized via the kube-proxy that runs on every Kubernetes node and updates iptables that route to the IP addresses of the pods.

Kubernetes will update the endpoints objects in the pods states so that it only contains pods that are ready to handle traffic.
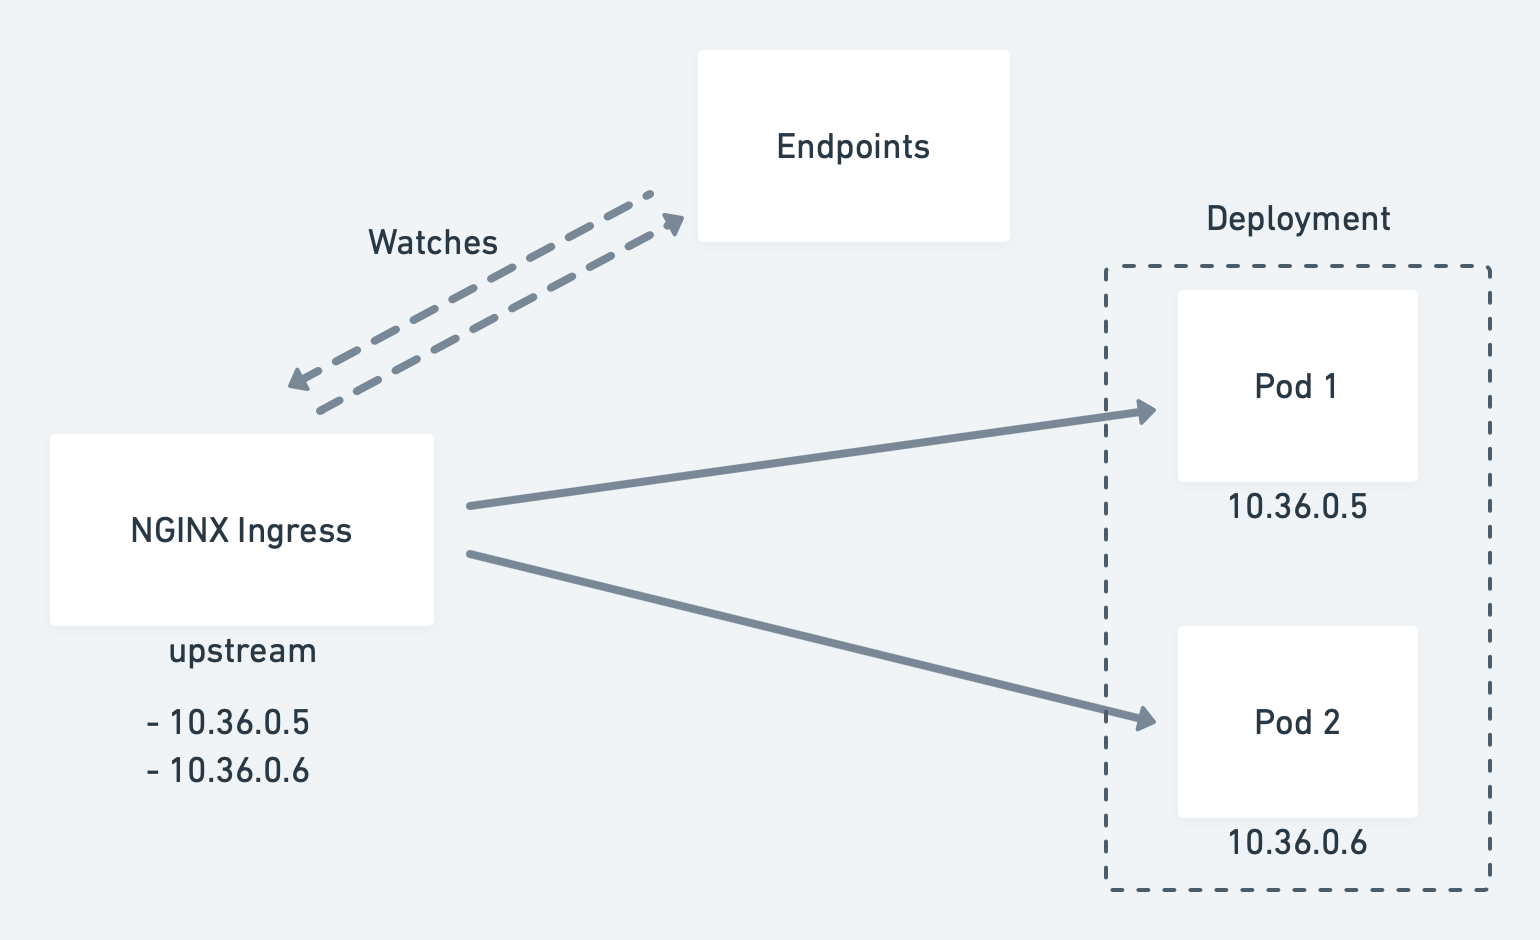
Kubernetes ingresses, however, connect to the instances in a slightly different manner. That’s the reason why we noticed different downtime behavior on rolling updates, when our client connected to the application through an ingress resource, instead.
The NGINX ingress directly included the pod addresses in its upstream configuration. It independently watches the endpoints objects for changes.

Regardless of how we connect to our application, Kubernetes aims to minimize the service disruption during a rolling update process.
Once a new pod is alive and ready, Kubernetes will take an old one out of service and thus update the pod’s status to Terminating, remove it from the endpoints object, and send a SIGTERM. The SIGTERM causes the container to shutdown, in a (hopefully) graceful manner, and to not accept any new connections. After the pod has been evicted from the endpoints object, the load balancers will route the traffic to the remaining (new) ones. This is what caused our availability gap in our deployment; the pod was being deactivated by the termination signal, before, or rather while the load balancer notices the change and can update its configuration. This re-configuration happens asynchronously, thus makes no guarantees of correct ordering, and can and will result in few unlucky requests being routed to the terminating pod.
The task at hand now was, how do we enhance our applications to realize (real) zero-downtime migrations?
First of all, a prerequisite to achieve this goal was that our containers handle termination signals correctly, that is that the process will gracefully shutdown on the Unix SIGTERM. Have a look at Google’s best practices for building containers how to achieve that.
The next step was to include readiness probes that check whether our application was ready to handle traffic. Ideally, the probes already check for the status of functionality that requires warm-ups, such as caches or worker initialization.
The readiness probes were our starting point for smoothing the rolling updates. In order to address the issue that the pod terminations currently does not block and wait until the load balancers have been reconfigured, we’d included a preStop lifecycle hook. This hook is called before the container terminates.
The lifecycle hook is synchronous, thus must complete before the final termination signal is being sent to the container. In our case, we use this hook to simply wait, before the SIGTERM will terminate the application process. Meanwhile, Kubernetes will remove the pod from the endpoints object and therefore the pod will be excluded from our load balancers. Our lifecycle hook wait time ensures that the load balancers are re-configured before the application process halts.
To implement this behavior, we define a preStop hook in our asgard deployment:
kind: Deployment
apiVersion: apps/v1beta1
metadata:
  name: asgard
spec:
  replicas: 3
  template:
    spec:
      containers:
      - name: zero-downtime
        image: docker.example.com/asgard:1
        livenessProbe:
          # ...
        readinessProbe:
          # ...
        lifecycle:
          preStop:
            exec:
              command: ["/bin/bash", "-c", "sleep 120"]
  strategy:
    # ...
It highly depended on our technology of choice of how to implement the readiness and liveness probes as well as the lifecycle hook behavior; the latter chooses a 20 seconds synchronous grace period. The the pod shutdown process only continues after this wait time.
When we now watched the behavior of our pods during the deployment, we’d observed that the terminating pod was in the Terminating status but wasn’t shutdown before the wait time period ended. To make our findings concrete, we re-tested our approach using the load testing tool, and was elated to find zero number of failed requests:
Fortio 1.1.0 running at 500 queries per second, 4->4 procs, for 20s
Starting at 500 qps with 50 thread(s) [gomax 4] for 20s : 200 calls each (total 10000)
[...]
Code 200 : 10000 (100.0 %)
Response Header Sizes : count 10000 avg 159.530 +/- 0.706 min 154 max 160 sum 1595305
Response Body/Total Sizes : count 10000 avg 168.852 +/- 2.52 min 161 max 171 sum 1688525
[...]
Kubernetes does an excellent job in orchestrating applications with production-readiness in mind. In order to operate our enterprise systems in production, however, it’s key that we engineers are aware of both how Kubernetes operates under the hood and how our applications behave during startup and shutdown.
Undertaking a root cause analysis of this issue was critical to ensure that the user experience wasn’t made upset during ongoing deployments and 100% delivery of all requests was ensured to our backend services.